Web Dashboard
HZL includes a built-in web dashboard for visual task management. Launch it with hzl serve.
Starting the Dashboard
hzl serveOpens the dashboard at http://localhost:3456.
Options
# Use a different port
hzl serve --port 8080

# Restrict to localhost only (default binds to 0.0.0.0 for network/Tailscale access)
hzl serve --host 127.0.0.1

# Run in background (fork to background process)
hzl serve --background

# Check if background server is running
hzl serve --status

# Stop the background server
hzl serve --stop

# Connect to an OpenClaw gateway for cron job management
hzl serve --gateway-url ws://127.0.0.1:18789 --gateway-token <token>

# Generate systemd unit file for always-on service
hzl serve --print-systemd > ~/.config/systemd/user/hzl-web.service
Gateway settings can also be set once in your config file — see CLI Reference.
Navigation
The left sidebar (nav rail) provides view switching:
| View | Description |
|---|---|
| Kanban | Task workflow columns |
| Agents | Agent fleet monitoring |
| Graph | Dependency visualization |
The sidebar can be collapsed to icon-only mode using the chevron toggle at the bottom. Collapse state persists across sessions.
On mobile, navigation switches to a fixed bottom tab bar.
Views
Kanban Board
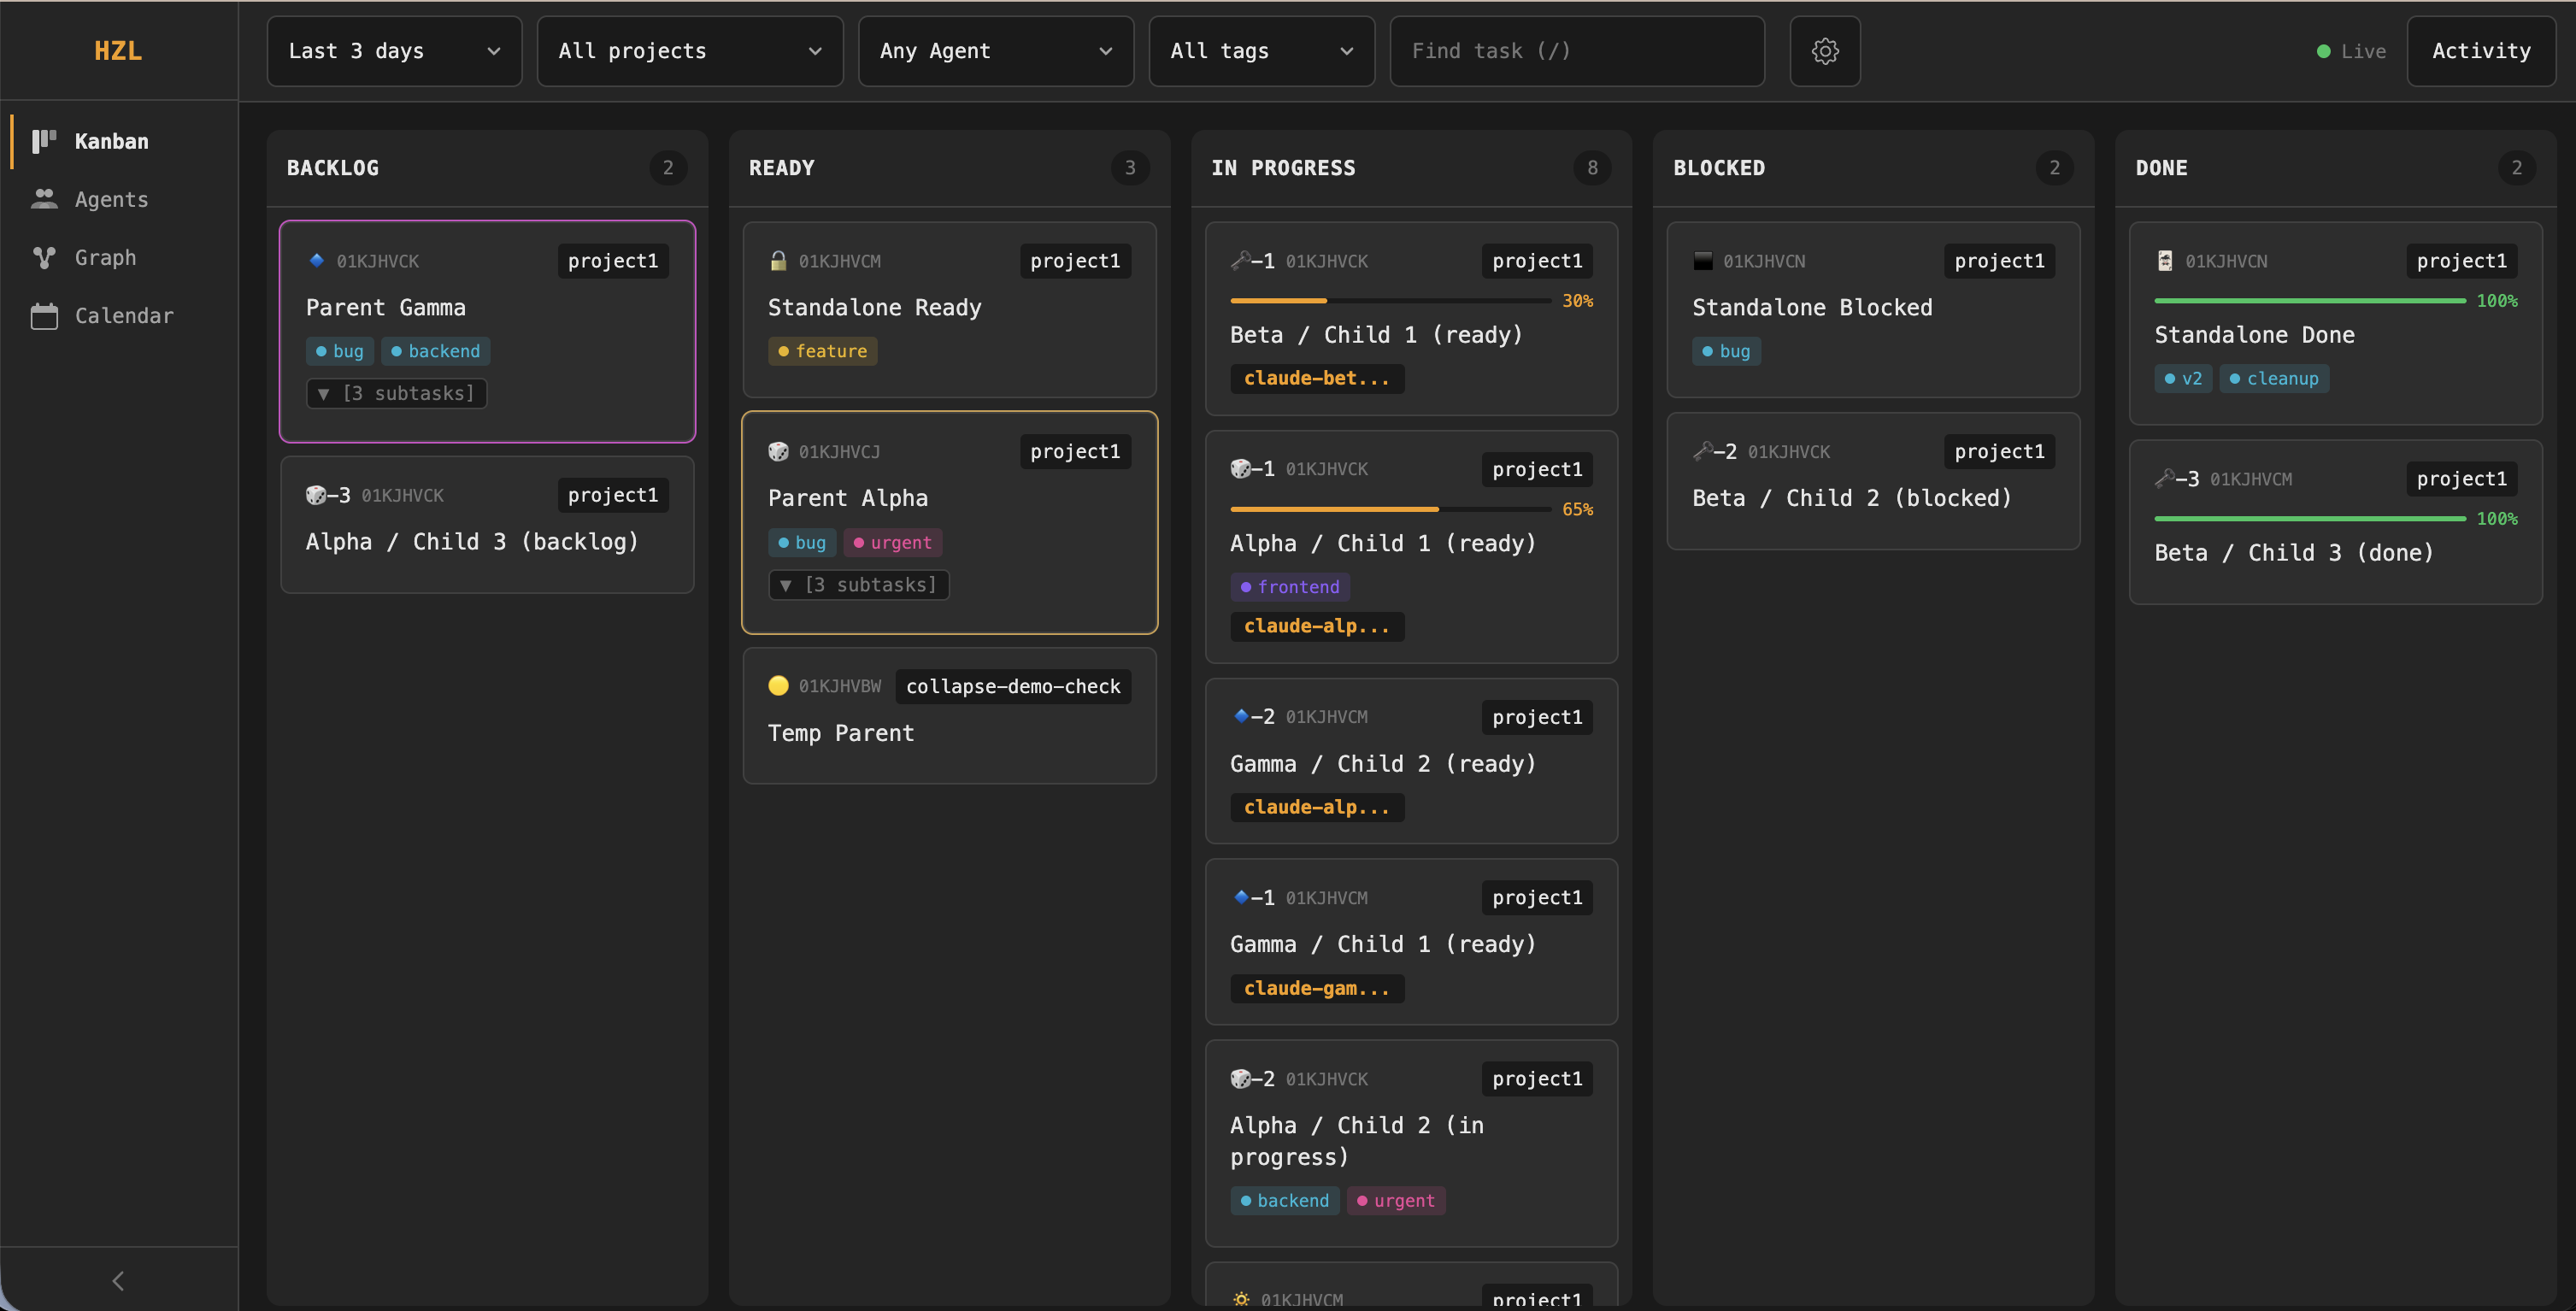
Tasks are displayed in columns by status:
| Column | Tasks Shown |
|---|---|
| Backlog | Not yet actionable |
| Ready | Available to claim |
| In Progress | Currently being worked on |
| Blocked | Waiting on dependencies |
| Done | Completed work |
Each column header shows the status name and a task count badge. A task marked ready but with unmet dependencies automatically appears in the Blocked column.
Task cards display:
- Emoji marker and truncated task ID (header left)
- Project name (header right)
- Progress bar with percentage (when progress > 0)
- Task title
- Tags (up to 3 inline, with
+Noverflow) - Subtask badge — shows
[N subtasks]or[N/M subtasks]when filtered - Assignee chip (when assigned)
Subtask support: Toggle "Show subtasks" in settings to reveal child tasks. When enabled, parent cards get a collapse/expand control. When disabled, parent cards show a subtask count badge instead.
On mobile, the multi-column layout is replaced by a tab bar — tap a status to see that column's cards.
Agent Operations Center
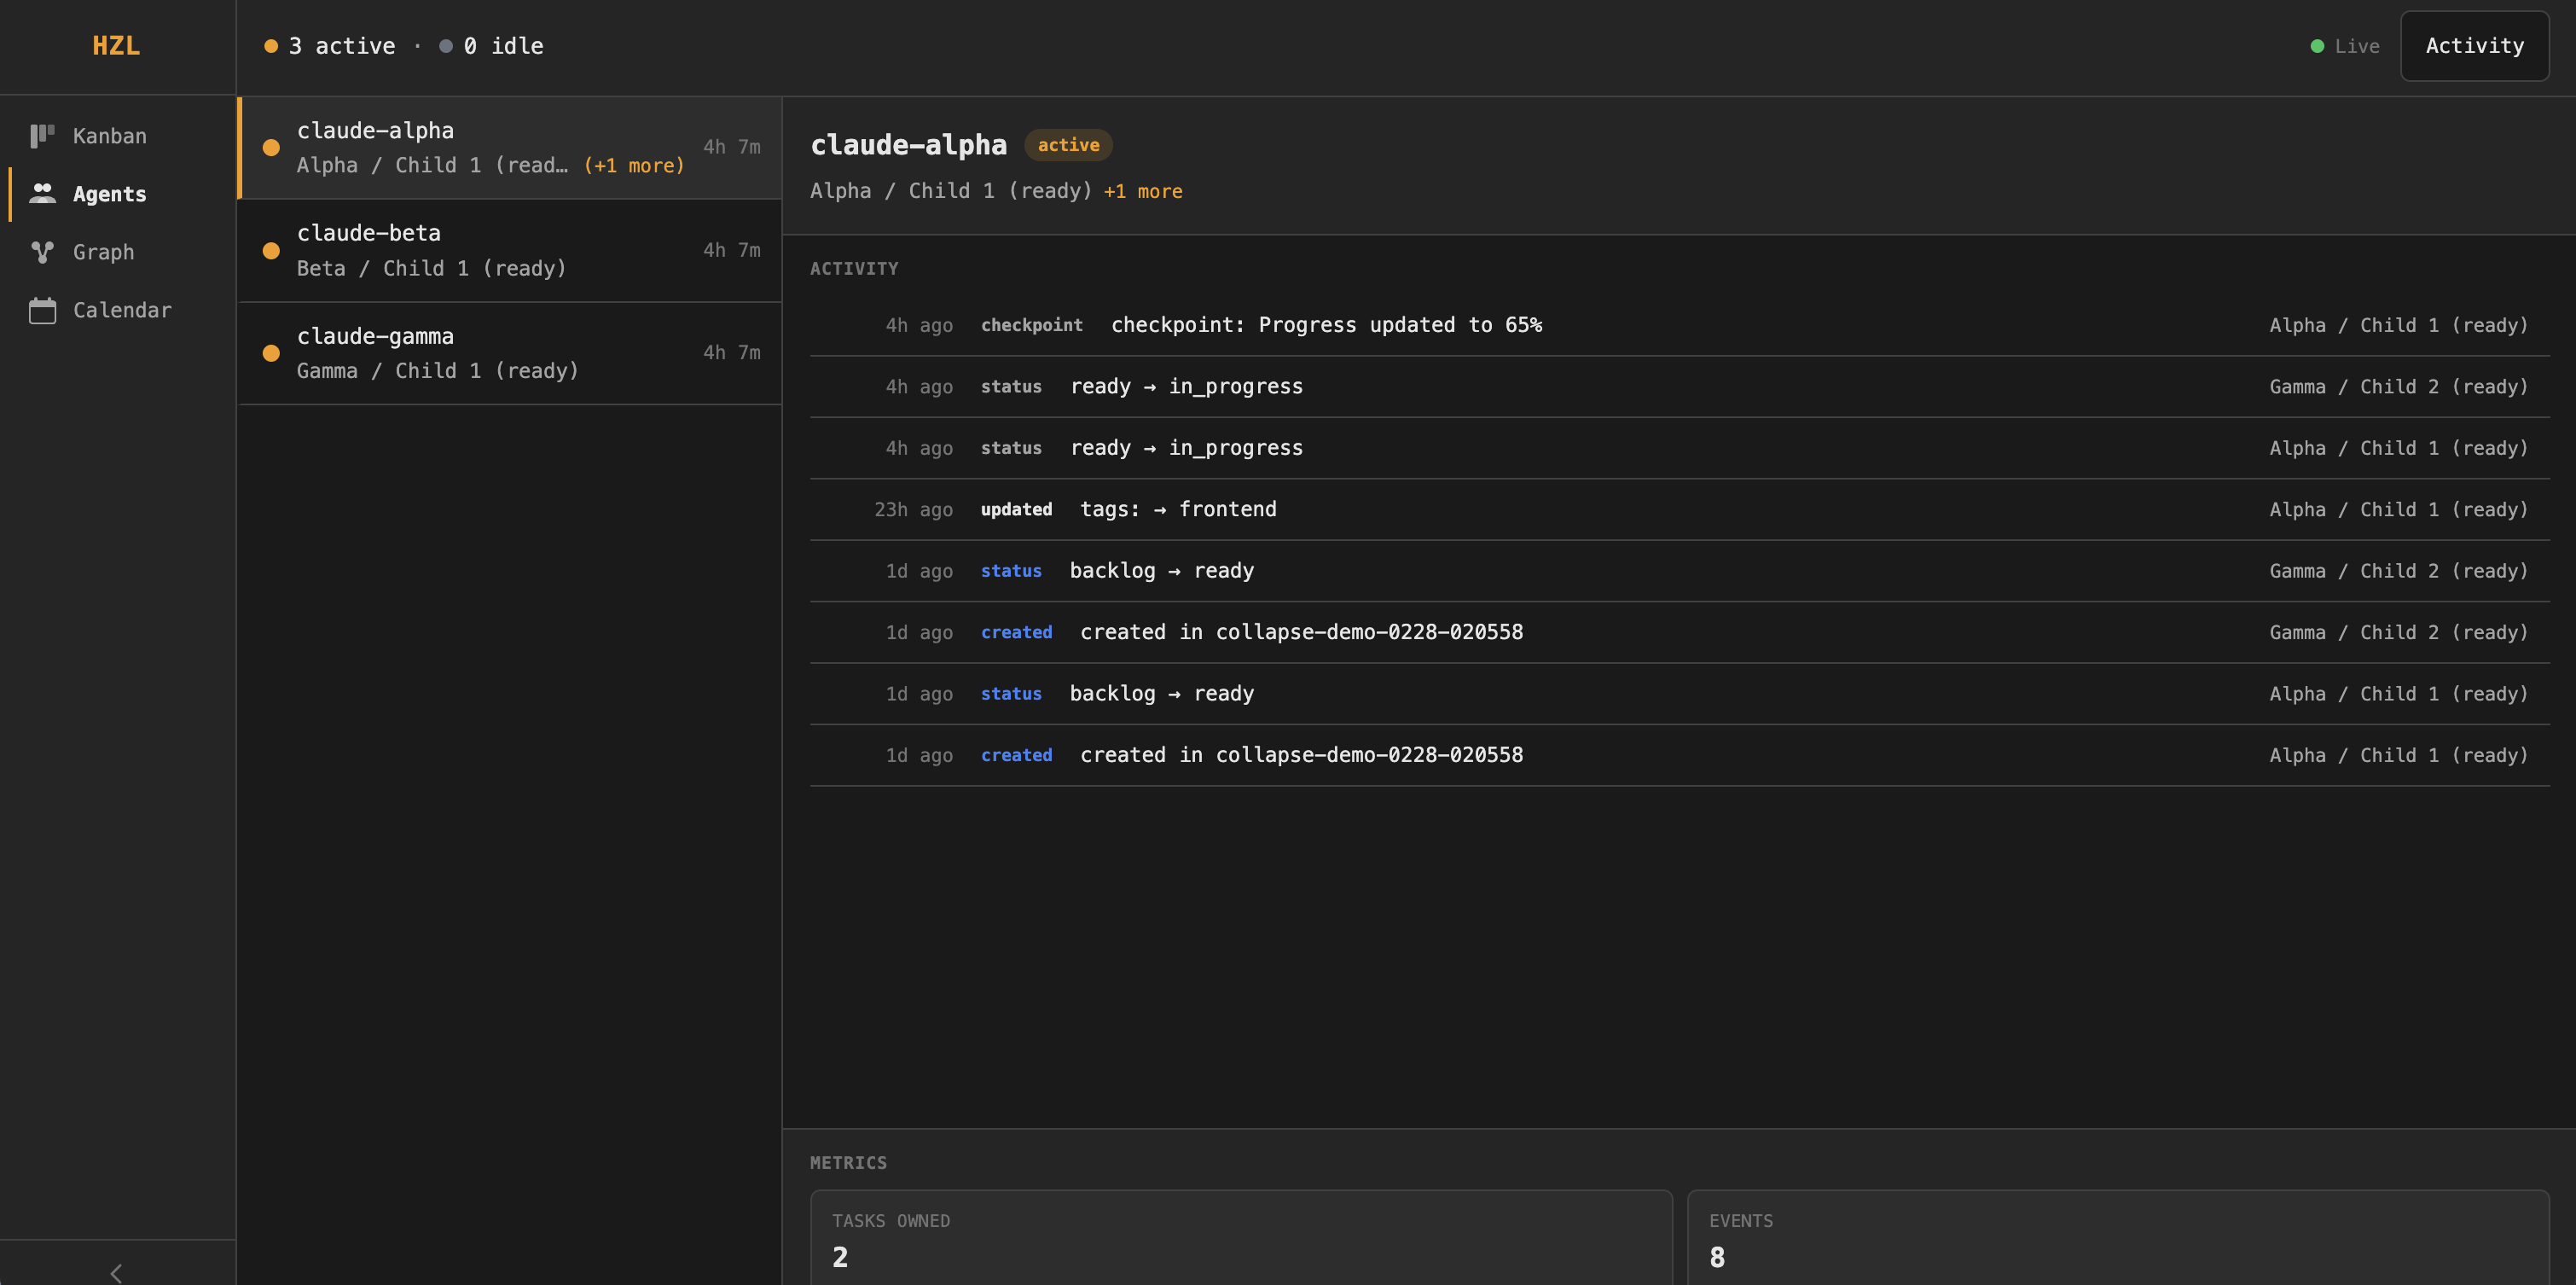
A split-panel layout for monitoring your agent fleet.
Fleet summary bar (top): Shows active and idle agent counts with colored status dots.
Agent roster (left panel): A scrollable, keyboard-navigable list of agents. Each entry shows:
- Status dot (colored for active, grey for idle)
- Agent ID
- Current task title and duration (if active), or idle duration (if idle)
(+N more)suffix when an agent owns multiple tasks
Agent detail (right panel): Select an agent from the roster to see:
- Agent ID and status badge (active/idle)
- Primary task title
- Metrics bar — tasks owned count and total event count
- Tabbed content with three tabs:
- Tasks — current task assignments for the agent
- Activity — paginated event timeline showing timestamped entries with event type badges (created, status, updated, commented, checkpoint, moved, dep added/removed, archived) and task context. Click any event to open the task detail modal.
- Cron Jobs — scheduled job management (only shown for agents connected via the OpenClaw gateway)
Use this view for monitoring fleet health, investigating what an agent has been doing, or auditing agent activity.
Cron Job Management
The Cron Jobs tab appears for agents that are registered with an OpenClaw gateway. It provides full lifecycle management of scheduled jobs.
Setup: If the gateway is not yet configured, the tab shows a connection form where you enter the gateway URL and optional auth token. Alternatively, pass --gateway-url and --gateway-token when starting hzl serve, or set them in your config file.
Job list: Each row shows:
- Enable/disable toggle
- Job name and human-readable schedule (e.g., "Every 2 minutes")
- Next run time (relative)
- Last run duration
- Error indicator with consecutive error count (only shown when errors exist)
- Actions: run now, edit, delete
Create/edit modal: A form with primary fields (name, schedule expression, timezone, payload message, model) and an expandable advanced section (description, schedule kind, session target, wake mode, timeout, agent ID, delivery settings). Client-side validation checks required fields and cron expression format before submitting.
Graph View
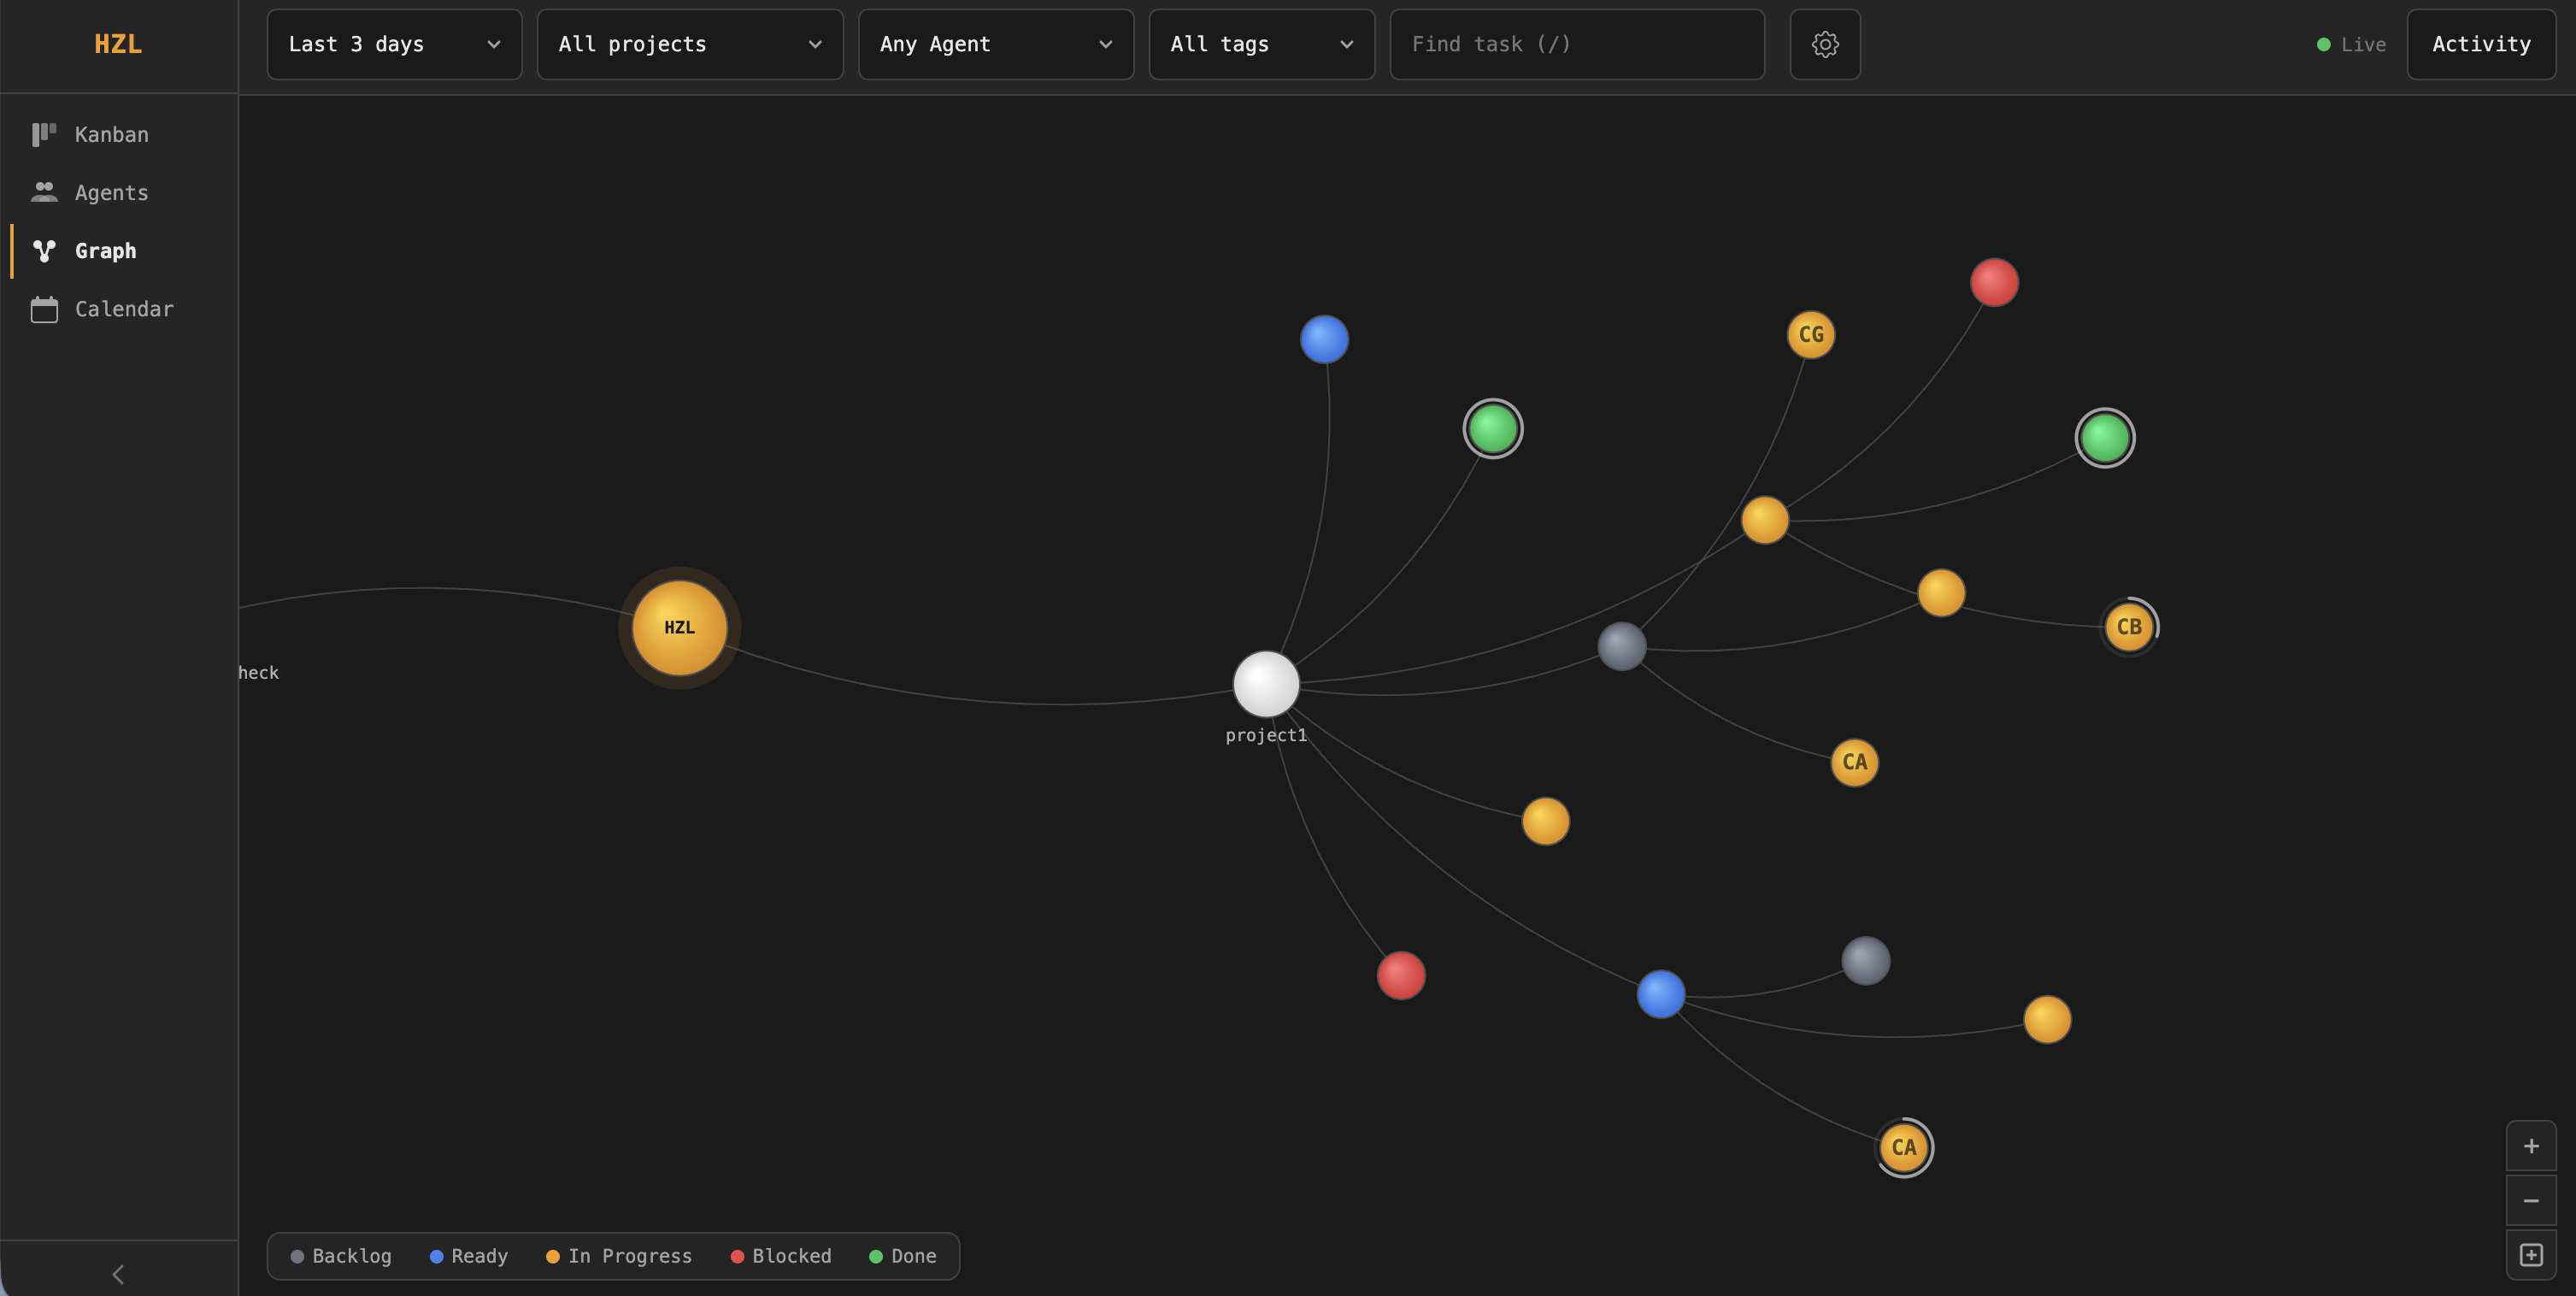
A force-directed visualization of projects, tasks, and dependencies rendered on a dark canvas.
Node types:
| Type | Description |
|---|---|
| Root | Central "HZL" node with animated pulsing aura |
| Project | One node per project, arranged in the first ring |
| Task | Top-level tasks in the second ring |
| Subtask | Child tasks in the outer ring |
Visual elements:
- Gradient-filled nodes colored by task status
- Progress arcs drawn around task/subtask nodes showing completion percentage
- Assignee initials rendered inside task nodes
- Hover highlights with a glowing aura ring; hover or zoom in to reveal task labels in dark pill backgrounds
Links:
- Hierarchy links (grey, curved) connect root → project → task → subtask
- Dependency links (red, straight, with arrows) show task dependencies, animated with flowing particles
Interactive legend (bottom-left): Five status buttons (Backlog, Ready, In Progress, Blocked, Done). Click one or more to filter — matching nodes stay fully visible while non-matching nodes dim. Ancestor nodes (root/project) dim partially to preserve context.
Zoom controls (bottom-right): + to zoom in, - to zoom out, and a fit-all button to frame the entire graph.
Click a task or subtask node to open the task detail modal.
Global Features
Search
Press / to focus the search input. Type 2+ characters to search across task titles and descriptions. Results filter visible tasks across all views. A match count appears when search is active. Press the × button or clear the input to reset.
Filters
The filter bar appears at the top of the dashboard (hidden in Agent Ops view):
| Filter | Options |
|---|---|
| Date range | Today, Last 3/7/14/30 days |
| Project | All projects or a specific project |
| Assignee | Any agent or a specific agent (with task counts) |
| Tag | All tags or a specific tag (with task counts) |
Additional settings available via the gear icon:
- Column visibility (Kanban only) — toggle individual status columns on/off
- Show subtasks — toggle subtask visibility
- Parent view — collapse all / expand all parent tasks
Filters persist across view switches and sessions via URL parameters and local storage.
On narrow viewports, filter dropdowns collapse behind a funnel icon button with an active-filter count badge.
Activity Panel
Press a to toggle the activity panel (or click the Activity button in the top bar). A slide-in drawer from the right showing recent events:
- Event type badge with relative timestamp
- Task title
- Detail string (e.g., "ready → in_progress by agent-name")
Filters: Agent/assignee dropdown and keyword search (3+ characters).
Click any event entry to open the task detail modal. Activity respects current column visibility and subtask settings.
Task Detail Modal
Click any task card (Kanban), graph node (Graph), or event entry (Activity/Agent Ops) to open the detail modal. Shows:
- Task metadata: ID, title, description, assignee, progress, tags, due date
- Tabbed content: Comments, Checkpoints, Activity
Keyboard Shortcuts
| Key | Action |
|---|---|
/ | Focus search |
a | Toggle activity panel |
? | Show keyboard shortcuts dialog |
Esc | Close open panels/modals |
Shortcuts are disabled when focus is inside an input field, textarea, or select element.
Real-time Updates
The dashboard uses Server-Sent Events (SSE) for live updates — no manual refresh needed. A connection status indicator in the top-right corner shows the current state:
| Status | Indicator |
|---|---|
| Live | Green dot |
| Connecting | Neutral dot |
| Reconnecting | Red dot |
If the connection drops, it automatically reconnects with exponential backoff. Switching back to the tab triggers an immediate reconnect.
Install as an App (PWA)
The dashboard supports installable web app metadata and icons (HZL), so you can install it like a native app.
Installability requirements:
http://localhost:3456works for local development.- Remote installs generally require HTTPS (for example, put HZL behind an HTTPS reverse proxy).
Desktop (Chrome/Edge)
- Start the dashboard with
hzl serve. - Open the dashboard URL in Chrome or Edge.
- Click the install icon in the address bar (or browser menu
Install HZL). - Confirm install.
Android (Chrome)
- Open the dashboard URL in Chrome on Android.
- Tap the browser menu.
- Tap
Install app(orAdd to Home screendepending on Chrome version).
iOS (Safari)
- Open the dashboard URL in Safari.
- Tap the Share button.
- Tap
Add to Home Screen. - Confirm the app name
HZL.
Background Mode
Run the dashboard as a background process:
hzl serve --background       # Fork to background, write PID
hzl serve --status           # Check if running
hzl serve --stop             # Stop the background server
Running as a Service (systemd)
For always-on access (e.g., on an OpenClaw box via Tailscale). Linux only. See also the Installation guide for the quick setup during initial install.
mkdir -p ~/.config/systemd/user
hzl serve --print-systemd > ~/.config/systemd/user/hzl-web.service
systemctl --user daemon-reload
systemctl --user enable --now hzl-web

# Enable lingering so the service runs even when logged out
loginctl enable-linger $USER
The server binds to 0.0.0.0 by default, making it accessible over the network (including Tailscale). Use --host 127.0.0.1 to restrict to localhost only.
macOS: systemd is not available. Use hzl serve --background or create a launchd plist.
When to Use Each View
| View | Best for |
|---|---|
| Kanban | Workflow status at a glance, standups, moving tasks through stages |
| Agent Ops | Monitoring agent fleet health, investigating what an agent worked on, auditing activity |
| Graph | Visualizing dependency chains, understanding project structure and hierarchy |
CLI is better for:
- Scripted automation
- Quick task operations
- Integration with other tools
Architecture
The dashboard is served by hzl-web, which reads from the same event-sourced database as the CLI. Changes made via CLI appear immediately in the dashboard and vice versa.
┌─────────────┐     ┌─────────────┐
│   CLI       │     │  Dashboard  │
│  (hzl)      │     │ (hzl serve) │
└──────┬──────┘     └──────┬──────┘
       │                   │
       └───────┬───────────┘
               │
        ┌──────▼──────┐
        │  hzl-core   │
        │  (events.db)│
        └─────────────┘
For technical details on the event-sourced architecture, see Architecture.